
Answers you can use today.
Workforce leaders need fast, accurate data on turnover, burnout, and retention risk. Seeqer delivers on‑demand intelligence.
When you buy a report our human analysts verify every number before it reaches you. You get a short deck in under 25 pages. No AI-generated filler. Just the answers to your real questions.
For Consumer Insights
Cultural intelligence that explains the "why" behind the spend. For CPG, retail, and brand strategy.

Latin American (LATAM) and Hispanic consumers drive 16% of total CPG growth in the U.S. Younger generations, especially Gen Z and Gen Alpha, are leading this shift. Flavor is no longer just about taste. It is about identity and exploration.
Gen Z and Alpha has moved beyond basic sweet and spicy. They now crave "swangy" flavors. That means sweet, spicy, and tangy all at once. They want real, authentic tastes from around the world. A flavor like gochujang, which was almost unknown five years ago, now fills entire shelves at major grocery stores. Brands that use these flavors without real cultural stories get rejected. Consumers want to know the technique and the story behind the ingredient.
The numbers show this is a permanent change. Over half of US consumers are drawn to Latin American flavors. Sauces like chimichurri and mole poblano are leading the way into mainstream products. Japanese and Korean flavors are also booming. Gochujang is now the fourth fastest-growing flavor in the US meat and meals category.
Latino and Hispanic consumers drive 16% of total CPG growth in the US.
Over half (about 54%) of the general US population is drawn to Latin American flavors.
Gochujang is the fourth fastest-growing flavor in the US meat and meals category.
Asian flavors like Japanese sauces and Korean gochujang are booming across frozen meals, snacks, and condiments.
Gen Z is actively seeking bold, spicy, umami-rich flavors from Asian cuisines as a form of personal expression.
Every report is human‑checked and delivered in one business day. You get the latest numbers, not last quarter’s.
Want to read a sample report? Click here.
Current data sources include Circana, Givaudan, Braque, and Datassential from 2025-2026.
61% of consumers aged 13-39 say they distrust influencers who post too many ads. For Gen Z, that number is even higher.
Creator fatigue is real. Young consumers are tired of fake relatability and over‑sponsored feeds. 32% of users have unfollowed an influencer because of staged or inauthentic content. When a creator feels like a salesperson, trust breaks. And once trust breaks, purchasing stops. Gen Z still buys from creators, but only the ones who feel honest. Sponsored posts that are not clearly labeled lose credibility fast. 83% of digital consumers check for clear sponsor tags before trusting a recommendation.
The shift is toward smaller creators. Micro‑influencers with dedicated followings feel more real. Gen Z also watches how often a creator posts ads. One or two is fine. A wall of #ads is not. 44% of people say they will lose trust if an influencer seems fake or overly staged. Authenticity is now the main driver of creator‑driven purchases.
61% of young consumers (13-39) distrust influencers who post too many ads. Too much sponsorship kills credibility.
32% of users have unfollowed a creator due to fake relatability or staged content.
83% of digital consumers check for clear sponsor tags like #ad before trusting a recommendation.
44% of consumers lose trust in an influencer who seems fake or overly staged.
78% of consumers now give more weight to peer opinions over sponsored creator recommendations.
Every report is human‑checked and delivered in one business day. You get the latest numbers, not last quarter’s.
Want to read a sample report? Click here.
Current data sources include Digital Voices 2025, Kids Insights 2025, YPulse, OnePulse, Billion Dollar Boy, and BBB National Programs' Influencer Trust Index 2025.
49% of Generation Alpha children trust influencer recommendations as much as those from family and friends.
That is a huge shift in how the youngest consumers make decisions. They are growing up surrounded by ads, so they tune out traditional advertising. Creator-led content is how brands reach them now. 65% of kids aged 10-14 trust a creator’s recommendations more than ads from traditional celebrities. But this trust is not automatic. It is fragile. Audiences today want transparency and real connection.
Here is the problem. Trust in influencers is declining across all ages. 61% of consumers aged 13-39 say they distrust influencers who post too many ads. 32% of users have unfollowed an influencer because of fake relatability. Sponsored content often feels scripted. 44% of people say they will lose trust if an influencer seems fake or overly staged. Consumers now prefer micro-influencers with smaller, more authentic followings. And 83% check for clear sponsor tags before trusting a recommendation.
49% of Gen Alpha trust influencers as much as family on purchases. Influencers rank as the second most influential factor, just behind peers at 28%.
61% of young consumers lose trust in an influencer who posts too many ads. 78% now give more weight to peer opinions over sponsored recommendations.
65% of kids aged 10-14 trust creator recommendations more than ads from traditional celebrities.
83% of digital consumers check for clear sponsor tags before trusting an influencer’s recommendations. Transparency is key to credibility.
32% of consumers view generative AI as a negative disruptor in the creator economy, up from 18% just two years ago. Enthusiasm for AI-generated creator content has dropped from 60% to 26%.
Want to read a sample report? Click here.
Current data sources include Digital Voices 2025, Kids Insights 2025, YPulse, OnePulse, Billion Dollar Boy, and BBB National Programs' Influencer Trust Index 2025.
87% of shoppers say they will pay more for a brand they trust. Yet 78% also rank price as a top priority. Middle‑income consumers live inside this tension every day.
The economy is splitting in two. High‑income households are spending more. Middle and lower‑income groups are cutting back. Nearly 1 in 4 U.S. households live paycheck to paycheck. That includes many middle‑income families. Wages for this group grew just 2% last year. Inflation has eaten away at those gains. So every purchase is a calculation. Does this product meet my needs? Does it fit my budget? Does it reflect who I am?
Younger consumers feel this pull the most. 96% of Gen Z say they shop with intention. Two‑thirds say it is important that their purchases reflect their values. Sustainability, national pride, and cultural alignment drive their choices. But many also feel judged. 32% of Gen Z fear buying from the wrong brand. At the same time, 55% of low‑income consumers now prefer cheaper store brands. So people are trading down on price but trading up on meaning.
68% of Americans, including many middle‑income households, are living paycheck to paycheck. That leaves little room for extras.
87% of shoppers will pay more for a brand they trust. Price can prompt a switch, but trust seals the sale.
92% of consumers consider themselves intentional with their purchases. 40% say they are very intentional.
45% of consumers say brand values will play a bigger role in their future purchases.
62% of shoppers now say it is important that their purchases align with their personal values or identity.
Every report is human‑checked and delivered in one business day. You get the latest numbers, not last quarter’s.
Want to read a sample report? Click here.
Current data sources include Salsify’s Q4 2025 Ecommerce Pulse Report (U.S.), Lightspeed Commerce’s 2025 Valuespending survey (U.S./Canada, n=2,000), and Bank of America Institute’s 2025 paycheck‑to‑paycheck analysis.
Nearly half (46%) of grocery shoppers want AI to recommend deals based on their current cart or past purchases. Younger consumers, especially Gen Z, are leading this shift.
AI is changing how young people find grocery and household products. More than one-third of shoppers (36%) have used AI to research, browse, or buy groceries. That is more than any other category. Over half of Gen Z AI users (53%) trust generative AI more than traditional sources. At the same time, social media is now a primary search tool. A full 86% of Gen Z search on TikTok weekly. They look for recipes, snack ideas, and product reviews. Many turn to TikTok first, not Google.
Gen Z’s shopping habits are different from older generations. One in three Gen Z (33%) now prefer AI platforms for product research. That is nearly as many as those who still use search engines (37%). Grocery discovery happens across many places. TikTok is the most useful social platform for researching new brands, according to 28.4% of US shoppers. Many Gen Z also trust AI product recommendations more than human ones. In fact, 23% of Gen Z say they trust AI platforms more than people for curated product picks.
36% of US shoppers have used an AI tool to research, browse, or buy groceries. Grocery leads all categories in AI-assisted shopping.
53% of Gen Z AI users find generative AI more trustworthy than traditional sources like search engines or brand websites.
86% of Gen Z search on TikTok weekly, nearly matching their use of traditional search engines like Google (90%).
33% of Gen Z now prefer AI platforms for product research, compared to 37% who still prefer traditional search engines.
62% of Gen Z use TikTok to discover new products, even as many pull back from buying directly through TikTok Shop.
Every report is human‑checked and delivered in one business day. You get the latest numbers, not last quarter’s.
Want to read a sample report? Click here.
Current data sources include Acosta Group’s 2025 AI shopper study (n=1,000 US shoppers), EMARKETER’s June 2025 retail survey, TikTok internal data (2025-2026), Commerce and Future Commerce’s September 2025 survey (n=1,000 consumers across US/UK/Australia/New Zealand), and YouGov’s July 2025 AI shopping assistant study.
Nearly half (46%) of Gen Z has used AI to purchase a product or service in the past six months. That is more than any other generation except millennials (49%).
AI is changing how young people shop. Many start with AI tools instead of a search engine. They ask for product ideas. They compare prices. They look for deals. Some even let AI make the final purchase for them. Brands that do not show up inside AI answers may never be considered at all.
Traditional search is losing ground for this group. A full 33% of Gen Z now prefer AI platforms like ChatGPT and Perplexity for product research. That is almost as many as the 37% who still use search engines. TikTok is also a major player. A startling 86% of Gen Zers now search on TikTok instead of traditional search engines. Social videos and AI tools together are becoming the new front door for commerce.
61% of Gen Z shoppers used AI tools to help with a purchase in the last year, according to a September 2025 PayPal survey.
42% have purchased a product they did not previously know about because AI recommended it.
33% of Gen Z now prefer AI platforms over search engines for product research, nearly matching the 37% who still use traditional search.
86% of Gen Zers search on TikTok instead of traditional search engines, per TikTok‘s own data.
48% of Gen Z shoppers are open to letting AI complete the final purchase on their behalf, according to Adyen’s 2026 retail report.
Every report is human‑checked and delivered in one business day. You get the latest numbers, not last quarter’s.
Want to read a sample report? Click here.
Current data sources include Klaviyo’s 2026 AI Consumer Trends Report, PayPal’s 2025 Holiday Shopping Survey, EMARKETER, PYMNTS, Adyen’s 2026 retail report, and TikTok internal data from 2025-2026.
Gen Z already commands $360 billion in buying power. Gen Alpha has over $100 billion in direct spending.
Most research treats Gen Alpha as "Gen Z 2.0." That is a mistake. Gen Alpha is different. By 2029, their spending power will reach $5.5 trillion. Roughly 1 in 3 US parents (31%) say their children influence household purchase decisions. These young consumers set trends before most brands notice. They also shift loyalty faster than any group before them.
The signals that matter to people 25 and under are not on most radars. They care about different things. They buy through different channels. They trust different voices. This report uncovers the top 3 to 5 forward-looking indicators for the next six months. You get the facts you need to move before the market shifts.
What the verified research shows:
Most Gen Alpha kids have their own money. The average Gen Alpha child has $67 to spend each week.
Gen Alpha kids are active co-creators. 97% want to help brands test new products and shape how stores look.
Gen Z cut overall spending by 13% early in 2025. But their global spending power will hit $12 trillion by 2030.
42% of all household purchases are now driven by Gen Alpha. That is nearly half of family spending.
Many brands still ignore these young buyers. That leaves a giant gap for competitors to fill.
Every report is human-checked and delivered in one business day. You get the latest numbers, not last quarter’s.
Methodology note: Data sources include DKC Analytics (2025), Mintel, Bloomberg, PwC, and Razorfish. This report is global with a US cut.

70% of Black consumers say they will stop buying from brands they see as devaluing their community.
Many CPG brands still treat cultural relevance as a one‑time campaign. They show up for a month and then go quiet. That approach creates risk. Consumers notice when brands are not consistent. They also notice when brands pull back support because of politics or backlash. Pullbacks can feel opportunistic and hurt trust. Lower trust leads to lower purchase intent.
Latino consumers in the U.S. now drive $4.1 trillion in economic output. Yet only 32.5% of Latinos believe brands share their values. That is a drop of more than 20 points since 2018. Meanwhile, 63% of LGBTQ+ audiences feel misrepresented in media. And 60% are actively looking for more accurate content. These gaps are not small. They are warning signs for brands that skip real research.
Two‑thirds of Black consumers pay more attention to brands that reflect their culture. That matters when you are planning a product launch or a new ad.
84% of Latinos are more likely to support brands that play a positive role in their family or community. Most national brands miss this connection entirely.
44% of US adults will increase support for brands that stay committed to LGBTQ+ inclusion. Among LGBTQ+ consumers, that number jumps to 80%.
Nearly half of Latinos prefer brands that advertise in Spanish. Language choice signals respect. Most CPG teams do not test this before they go to market.
Every report is human‑checked and delivered in one business day. You get the latest numbers, not last quarter’s.
Current data sources include Nielsen Attitudes on Representation Study (2025), Hispanic Sentiment Study 2025 (We Are All Human Foundation / TelevisaUnivision), and Disqo & Do the Werq LGBTQ+ Advertising Report (2025).
Black households make nearly 800 shopping trips per year. That is more than any other ethnic group.Yet most syndicated data misses where they actually shop.
Big scanner data focuses on national chains. It does not track bodegas, carnicerías, independent Asian grocers, or beauty supply stores. Hispanic shoppers prefer convenience stores 50% more than the average shopper for food. For non-food items, that number jumps to 180%. These stores are not just convenient. They are trusted community hubs.Brands that ignore these channels miss millions of daily transactions. Independent stores stock products that reflect cultural tastes. They offer a personalized experience larger chains cannot match.
The geography matters too. Houston, Los Angeles, Miami, Atlanta, and the Bay Area have dense networks of these independent stores. Asian Americans index more than 2 times versus the total market in club shopping.But they also spend more per trip at national Asian grocers like H Mart and 99 Ranch than they do at conventional grocery stores.Two-thirds of Latinos say private label provides good value. More than 60% are excited to try new private label products. Black consumers prioritize trust and consistency. They are also more concerned about DEI than any other group. 20% cite it as a concern versus just 8% of the total U.S. population.
Black households make nearly 800 shopping trips per year across CPG, general merchandise, and QSR. That is the highest of any ethnicity.
Hispanic shoppers prefer convenience channels 50% more than the average shopper for food. For non-food, it is 180% more.
Asian Americans index more than 2 times versus the total market in club shopping.
Two-thirds of Latino and Black consumers say private label provides good value. More than 60% of Latinos are excited to try new private label products.
20% of Black consumers cite DEI as a concern versus just 8% of the total U.S. population. That affects where and how they spend.
Every report is human-checked and delivered in one business day. You get the latest numbers, not last quarter's.

48% of U.S. consumers are ready to switch brands if prices rise due to tariffs.
Many households feel squeezed. They see prices going up. They also see product sizes getting smaller. These changes feel unfair. 62% of consumers suspect businesses are raising prices and lowering quality at the same time. This breaks trust. When trust breaks, loyalty breaks too.
Younger shoppers are changing their habits fast. 63% of Millennials and 58% of Gen Z are already spending like there is a recession. This is the first time they are doing this as adults. They are more likely to switch brands. 64% of Gen Z shoppers say they have changed where they spend their money. These shoppers are not just looking for cheap prices. They want to know why a price went up. They also want the brand to be honest.
67% of U.S. consumers would accept a price hike if the brand clearly explains the reason. Silence or surprises push them away.
61% of all consumers are already trading down to cheaper products. Many switch to store brands.
79% of Gen Z shoppers wait for a sale before buying. Yet 90% will pay more for a brand they trust. Fair pricing builds loyalty.
86% of shoppers now buy private label products for at least some items. Many say store brands are just as good as national brands.
36% of shoppers have left their favorite brand just to find a better price. Price is now the main reason they switch.
Every report is human-checked and delivered in one business day. You get the latest numbers, not last quarter’s.
Current data sources include DEPT® NavigatorIQ (n=4,000+ across five markets, June 2025), Gartner (n=1,539 U.S. consumers, October 2025), EY Future Consumer Index (n=20,000 across 26 countries, March 2025), Korn Ferry/Savanta (U.S. May 2025), RDSolutions (n=250 U.S. grocery shoppers, May 2025), and PwC Gen Z analysis (2025).
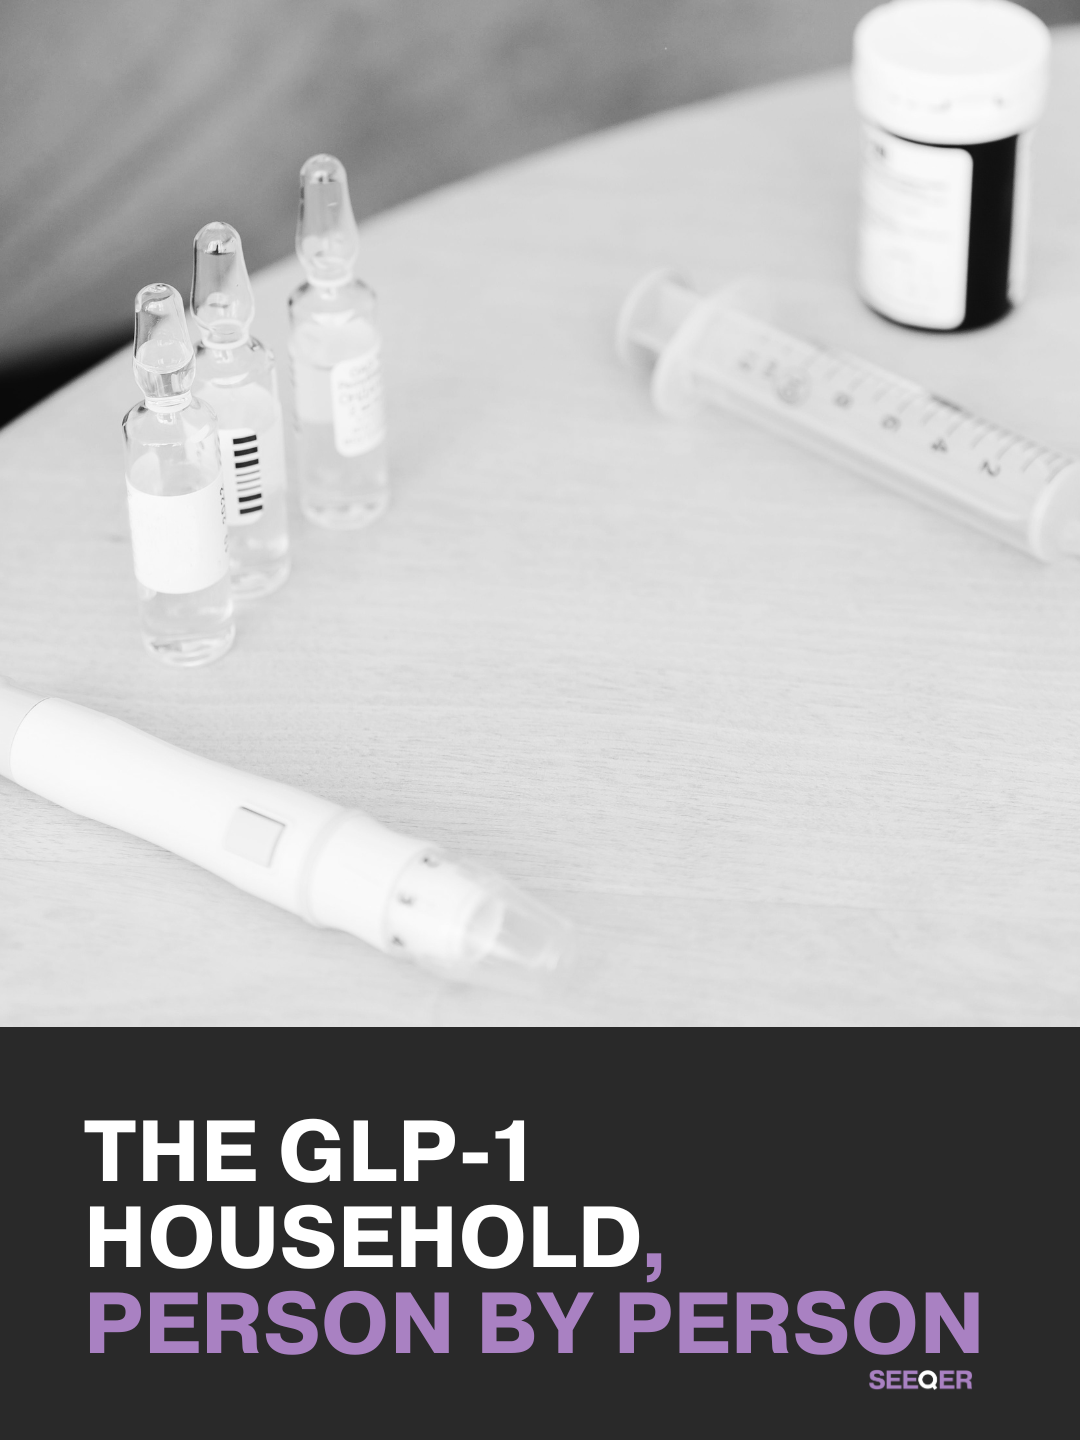
Many people in the same house do not eat the same way. One person uses GLP-1 medication. The rest of the house keeps old eating habits.
Inside a GLP-1 household, food behavior splits apart. The user may stop late night snacks. They may eat smaller portions. But other family members often buy and eat the same foods as before. This creates conflict in the grocery cart. One person wants yogurt. Another wants cookies. Both end up in the same basket.
The tension gets worse over time. Many GLP-1 users struggle alone. They hide what they eat. They feel guilt after a treat. Other household members may not know how to help. The result is a cycle of restriction and secret eating.
Every report is human-verified before delivery. You get the latest numbers, not last year’s.
55% of GLP-1 users say they buy more fresh produce. Fewer sweets and salty snacks go into the cart.
Nearly half of GLP-1 users say their healthy habits influence the whole household. But many family members still buy indulgent foods.
One in five former users say cravings returned after stopping the medication. The same share had already regained some or all of the weight they lost.
People on GLP-1s describe a quieting of "food noise," the constant thoughts about eating. When the medication stops, those thoughts often return.
69% of users report snacking less overall, but secret consumption and emotional restriction cycles remain common, especially in mixed households.
You buy it now. We verify the intelligence and deliver it within 12 hours. You get the most current data.
Every report is human-checked and delivered in one business day. You get the latest numbers, not last quarter’s.
Current research draws from Acosta Group, IGD, and published research in the Journal of Marketing Research from 2025 and 2026.

86% of U.S. shoppers have switched to store brands for at least some of their regular purchases. That is 6 in 10 people. Many plan to stick with private label for good.
People are not just switching to save money. Trust is shifting too. 37% of shoppers now trust the quality of private label goods above national brands. Another 47% say store brands are just as good. Retailers have invested heavily in better packaging, design, and marketing. The old stigma is gone. 77% of consumers feel no hesitation about buying private label anymore. This is not a temporary change. It is a permanent shift in how people shop.
Affluent shoppers are driving the trend. 44% of higher‑income households are buying more private label than last year. That is 10% more than lower‑income shoppers. 39% of these households now regularly buy premium private label products. Many see it as “shopping smart,” not trading down. Younger shoppers feel the same. 71% of Gen Z consumers sometimes or always buy cheaper versions of name brands. 88% of all shoppers plan to maintain or increase their private label habits.
Private label U.S. sales hit $330 billion in 2025. That is a 24% unit share of the CPG market.
44% more shoppers chose store brands over name brands in 2025 compared to the prior year.
45% of consumers have permanently switched from a national brand to a store brand when quality met or exceeded expectations.
Only 48% of consumers still call themselves brand loyal. The rest are “brand curious” or price‑driven.
Higher‑income households purchased 10% more private label products than lower‑income households from 2025 to 2026.
Every report is human-checked and delivered in one business day. You get the latest numbers, not last quarter’s.
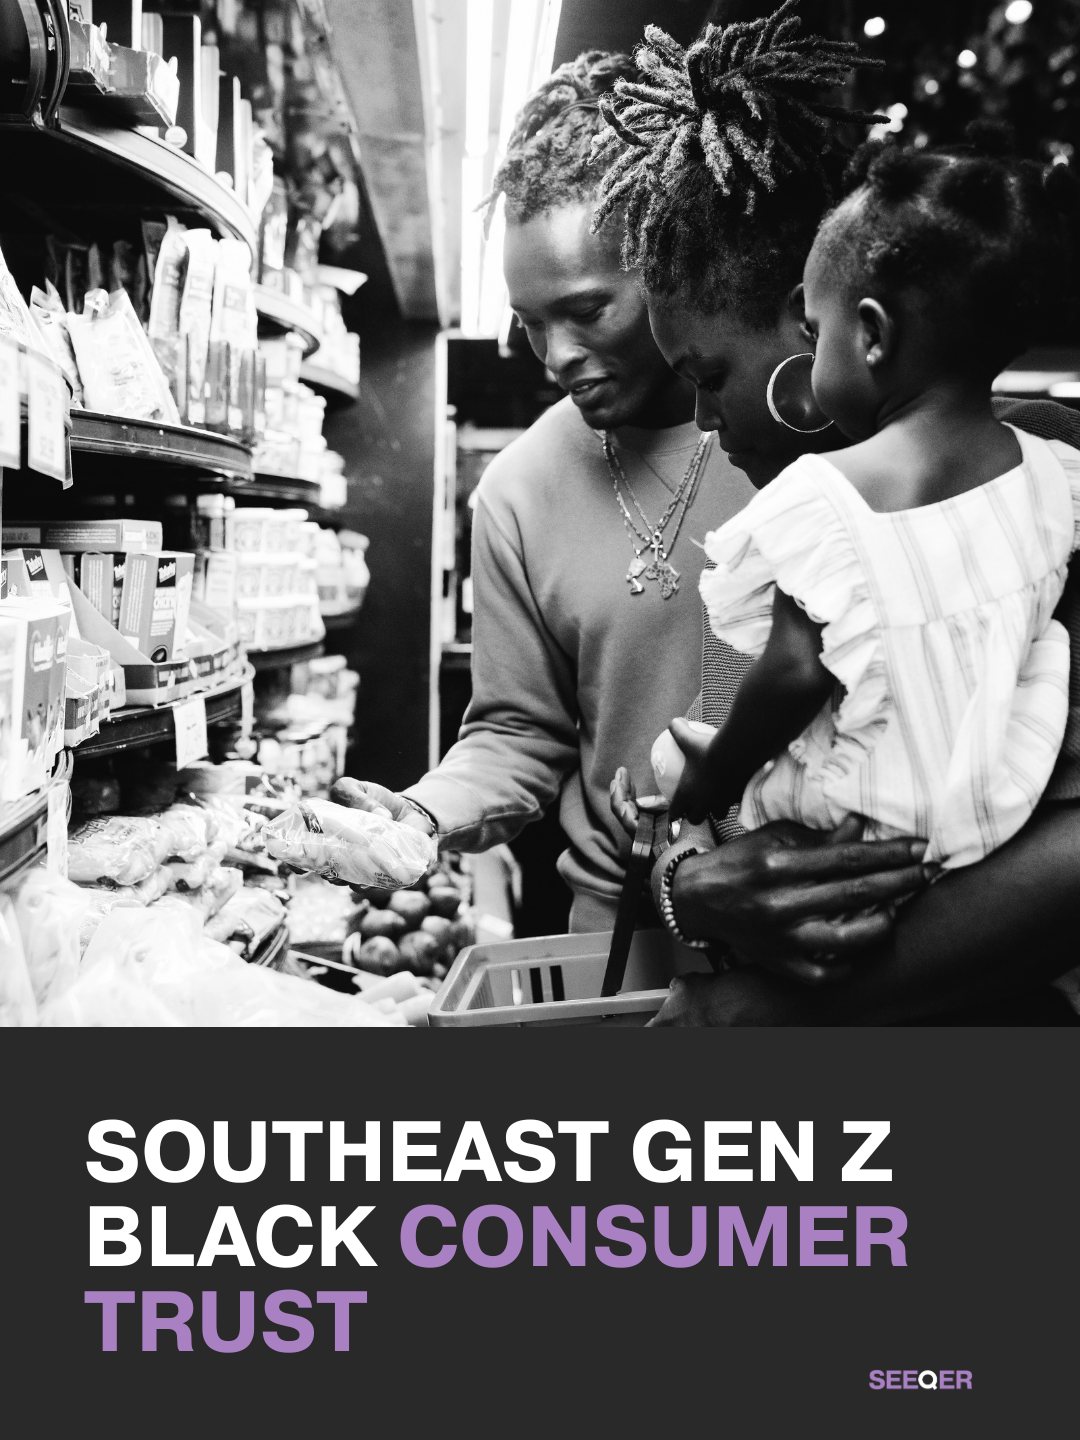
64% of Black Gen Z consumers take direct action based on a brand's sociopolitical stance. That means they choose to buy from a brand or boycott it.
In the U.S. Southeast, this generation is paying close attention. States like Georgia, Alabama, Mississippi, North Carolina, and South Carolina have strong Black communities and a deep culture of local business. When big companies pull back on diversity, equity, and inclusion (DEI), Gen Z Black shoppers notice. Many feel the pullbacks are not just political moves. They feel personal. A retail boycott in the Southeast, including calls from an Atlanta pastor, has gained real momentum.
Trust is the main driver. Over 70% of Black consumers say they will stop buying from brands perceived as devaluing their community. But trust can also be rebuilt through authentic engagement. Over 80% of Gen Z and Millennials say they benefit when Black culture is well‑represented. However, nearly half of Gen Z adults (40%) have already stopped buying from a brand that reversed its DEI efforts. This is not an abstract value. It directly changes shopping behavior.
64% of Black Gen Z consumers take action based on a brand's sociopolitical stance—choosing to buy from or boycott brands.
70% of Black consumers will stop buying from brands perceived as devaluing their community.
40% of Gen Z adults have stopped using or purchasing from brands that contradicted or reversed DEI efforts.
80% of Gen Z and Millennials say they personally benefit when Black culture is well‑represented.
In 2026, Black buying power is projected to reach $2.1 trillion, making this group a major economic force.
Every report is human-checked and delivered in one business day. You get the latest numbers, not last quarter’s.
This report currently synthesizes data from Nielsen, Horowitz Research, Urban One‘s Cultural ROI study, and the Collage Group as of 2025-2026.

Households with one GLP-1 user cut grocery spending by 5% to 8% within six months.
That is a big change for one person. The effect spreads to the whole family. Non-users in the house often start eating smaller portions too. They buy fewer salty snacks and sweets. Meal patterns shift for everyone, not just the person on medication.
The change does not stop at the kitchen. Many people on GLP-1s eat out less often. Two-thirds of users told researchers they spend less at restaurants. And many hide their treatment. Two-thirds keep it a secret from some family and friends. That secret can strain household dynamics. It may also lead to secret eating or rebound cravings when the medication stops.
Every report is human-verified before delivery. You get the latest numbers, not last year's.
80% of GLP-1 users need new clothing because their size changed. Many are rebuilding their whole wardrobe.
54% of GLP-1 users dine out less often. At the same time, 70% cook at home more frequently since starting the drug.
23% of U.S. households now have at least one GLP-1 user. That is a four-point jump from the year before.
Premium chocolate spending grew 17% among GLP-1 users in 2025. Non-users increased spending just 6.5%.
Households on GLP-1s spend 8% less at fast-food restaurants and coffee shops. Higher-income homes cut more than 8%.
You buy it now. We verify the intelligence and deliver it within 12 hours. You get the most current data.
Every report is human-checked and delivered in one business day. You get the latest numbers, not last quarter's.
Current research draws on peer-reviewed research from Cornell University (Journal of Marketing Research, 2025), plus consumer transaction data from Circana, Numerator, and J.P. Morgan Global Research.

Gen X women spent an average of $2,276 on beauty, health and wellness products in the last year. That is 16% more than other consumers.
Gen X (born 1965-1980) quietly became the world’s top spenders. They drive 31% of all U.S. spending across every retail category. But most brands still focus on younger shoppers. Many Gen X women walk into stores and feel the marketing is not for them. That feeling grows into fatigue. They feel overlooked and unheard. This gap raises turnover risk and hurts engagement for HR leaders who depend on brand loyalty.
The disconnect runs deeper than age. Over 75% of women feel mainstream brands prioritize younger demographics. That leaves an entire generation feeling invisible. Gen X women control household finances. They influence 70% to 80% of all consumer spending. They also manage caregiving for both children and aging parents. That pressure shifts how they spend. And it changes what they expect from the brands and workplaces they trust.
Menopause is a giant ignored market. The U.S. menopause health market is valued at $131 billion. It covers 63 million American women.
Gen X women turn to digital health sources less than younger groups. Only 29% use social media for health information. Younger women use social media at 56%.
Influencer marketing largely misses this group. 92% of Gen X use social media daily. But only 5% of influencer budgets target them.
Gen X women spend $75,879 each year on average. By 2030, that spending will near $100,000 per person.
49% of women still feel brands do not understand them. Many say products do not reflect their real needs.
Every report is human‑checked and delivered in one business day. You get the latest numbers, not last quarter’s.

91% of Hispanic Gen Z say their cultural heritage is an important part of who they are.
Many brands still try to reach Latino Gen Z by picking one language. Spanish or English. But that choice misses the real point for most young Latinos. They use Spanglish freely. 20% of Hispanic Gen Z prefer to communicate in Spanglish over English or Spanish alone. Their identity is not either-or. It is both. When ads feel inauthentic, 87% can spot it instantly. That weakens trust. It also hurts retention risk over time. Employees who feel a brand ignores who they are often disengage.
The differences across regions matter too. California’s Latino GDP reached $989 billion in 2023 and will top $1 trillion in 2025. Texas and Florida each add hundreds of billions more. Young Latinos in Texas may connect differently than those in Miami. Yet only 29% of Hispanic Gen Z say language in ads is their top priority. Instead, 67% want brands to show shared values, lived experiences, and cultural signals that feel real. Leaders who skip this listening gap raise their turnover risk. Their workforce planning misses the real drivers of engagement and wellbeing.
59% of Hispanic Gen Z reward brands that acknowledge their heritage. 42% make a purchase after seeing culturally authentic content.
Nearly 80% of Gen Z Latinas strongly identify with their heritage. They expect the businesses they support to show that same cultural understanding.
Bicultural Latinos are 60% more likely than the average consumer to buy from brands that reflect them. 61% will pay more.
Young Latino households (Gen Z and Millennials) drive 65% of all Hispanic spending in the U.S. They are 1.5 times more likely to shop online than the general population.
68% of Latino youth say not enough brands do a good job representing people like them. That feeling has grown each year.
Every report is human‑checked and delivered in one business day. You get the latest numbers, not last quarter’s.
Current data sources include LatiNation/ThinkNow 2025 Hispanic Gen Z study (n=400), Latino Donor Collaborative/Kantar 2024 Latino Youth Report, iHeartMedia bicultural Latinos study, NielsenIQ 2025 multicultural report, and LDC 2025 U.S. Latino GDP Report Part Two.
For the first time, moderation has edged out taste as the top consideration when drinking (35% vs. 33%).
Nearly half of Gen Z plan to cut back on alcohol. Gen Z is also 17 times more likely to never drink compared to Boomers. This is a big change. Health matters more now. Young people want to feel in control. They do not want to lose weekends to hangovers. Many also say money is tight. They would rather spend on other things.
The shift is not the same for everyone. Young women are leading the change. Many say they feel better when they do not drink. Men are moving more slowly. People in cities see more non‑alcoholic options. People in small towns see fewer. This report shows the real splits by gender, income, and where you live.
What the verified research shows:
Many Gen Z drinkers now prefer daytime drinking over late nights. They want to protect their sleep and their morning routines.
Two out of three Gen Z adults still drink. But more than 40% say alcohol is not an important part of their lives.
Health and cost are the top reasons Gen Z drinks less. Many also say alcohol feels less appealing than it used to.
Over half of Gen Z say they will drink less this year. That is more than any other generation.
Every report is human‑checked and delivered in one business day. You get the latest numbers, not last quarter’s.
Current data sources include the International Alliance for Responsible Drinking (IARD), Datassential, and Flinders University studies from 2025‑2026.
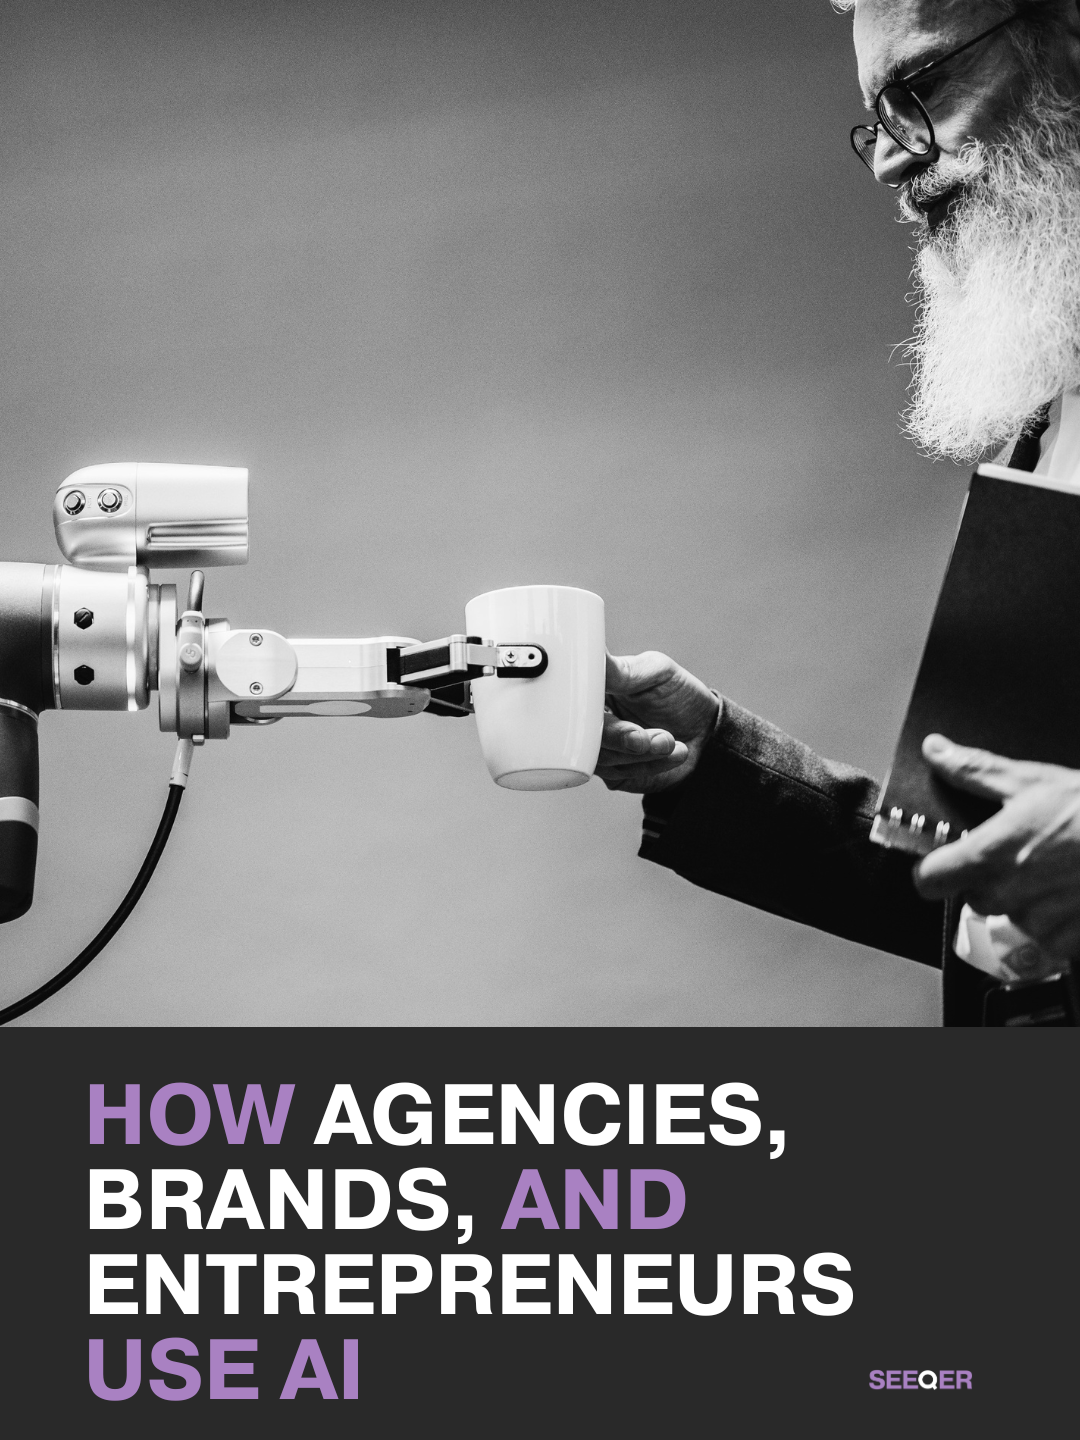
Three-quarters of small business owners have adopted AI tools. 95% of those users consider AI moderately to extremely important for their success. Yet 79% of organizations still struggle with AI adoption.
Many organizations are trying to use AI. They buy tools and run small tests. But most get stuck. They do not know how to move from testing to real results. A 2025 MIT study found that 95% of enterprise AI pilots fail to deliver measurable business impact. That is not a technology problem. It is a strategy problem. Organizations that treat AI as a cheap add-on waste their budget. Those that treat AI as a core part of their business plan pull ahead.
The gap shows up differently for different groups. Small business owners who rely heavily on AI are much more likely to call themselves experts. Yet only 41% of adopters feel highly proficient. Most still say they understand only the basics. Agencies and brands also struggle. Only 49% are using or planning to use key solutions like clear use cases, formal training, and governance boards. The rest are left vulnerable to falling behind their competition.
What the verified research shows:
75% of executives admit their company's AI strategy is more for show than real guidance. 48% call adoption a "massive disappointment."
Data analysis is the most common AI use (51% of small businesses). But only 18% use AI for sales and lead generation. Many are missing the highest value applications.
70% of small business owners believe AI will be very or extremely important to their company's success over the next few years. Yet only 28% of employees feel properly trained to use AI at work.
54% of C-suite executives say adopting AI is tearing their company apart. The challenges are not technical. They are cultural and organizational.
Every report is human‑checked and delivered in one business day. You get the latest numbers, not last quarter’s.
Current data sources include Writer 2026 Enterprise AI Adoption Survey (n=2,400 global leaders), SoFi Spring 2026 small business survey (n=500+), WalkMe research, IAB State of Data 2025 (n=500+ agencies, brands, publishers), and MIT NANDA 2025 State of AI in Business report.
Want to read a sample report? Click here.
For People and Culture
Contingent workers make up 38% of the U.S. workforce today. That share is projected to reach 50% by the end of the decade.
Yet most companies do not measure how these workers feel. Contingent and gig workers are routinely excluded from engagement surveys and listening tools. Many feel invisible. That leads to higher turnover risk and lower wellbeing. They have no clear path to speak up about burnout or retention concerns. While 65% of organizations plan to increase their use of contingent labor, few have a plan to engage them.
The result is a two‑tier workforce. Full‑time employees get support, training, and feedback loops. Contingent workers get none of that. They are expected to perform without connection to the company culture. This creates real retention problems. Many contingent workers leave at the first sign of a better offer. Workforce planning fails when you cannot see half of your people.
Contingent workers are 38% of the U.S. workforce today.
That share is projected to reach 50% by the end of this decade.
65% of organizations plan to increase their use of contingent labor.
Contingent workers are routinely excluded from engagement listening.
Most companies do not track engagement, retention risk, or burnout for gig and contingent workers.
Every report is human‑checked and delivered in one business day. You get the latest numbers, not last quarter’s.

Most frontline workers do not sit at a computer. They work in retail, logistics, manufacturing, hospitality, and healthcare. They are often disconnected from company news, training, and feedback loops. This leads to higher turnover and burnout. Many feel invisible to leadership. Retention risk is very high for these roles. When engagement is low, productivity falls and people leave faster.
Here is the real challenge. 83% of deskless workers lack a corporate email address. That means most companies cannot reach their own frontline employees directly. Software and tools are built for office workers. Only about 1% of all software spending goes to tools for deskless teams. This gap makes workforce planning nearly impossible. You cannot fix what you cannot measure.
80% of the global workforce is deskless. That is roughly 3 billion people.
Only 41% of deskless workers are engaged at work.
83% of frontline employees do not have a corporate email address.
Only about 1% of enterprise software spending targets deskless workers.
Low engagement on the frontline drives higher voluntary turnover and burnout.
Every report is human‑checked and delivered in one business day. You get the latest numbers, not last quarter’s.

Manager engagement has collapsed from 31% in 2022 to just 22% in 2025.
That is a drop of nine points in only three years. The steepest fall happened between 2024 and 2025 when engagement dropped five points from 27% to 22%. Managers are burned out. Many feel overwhelmed by conflicting demands from executives and employees. Their wellbeing has dropped faster than any other group. When managers disengage, their teams soon follow. Managers account for 70% of all team engagement. That means a disengaged manager creates a disengaged team.
Young and female managers are suffering the most. Managers under age 35 saw engagement fall by five percentage points. Female managers dropped by seven points, the largest decline of any group. At the same time, fewer than half of managers have ever received formal training to help them coach their teams. Many are left to figure out leadership on their own.
Global manager engagement fell from 31% in 2022 to 22% in 2025.
The steepest drop happened from 2024 to 2025, falling five points from 27% to 22%.
Managers under 35 saw engagement fall five percentage points.
Female manager engagement fell seven percentage points.
Fewer than half (44%) of managers have ever received formal training.
Every report is human‑checked and delivered in one business day. You get the latest numbers, not last quarter’s.
Current data sources include Gallup’s State of the Global Workplace 2026 report and other verified 2025-2026 workforce studies.

Only 67% of leaders are familiar with AI agents, compared to 40% of employees. And 81% of leaders feel safe suggesting new ways of working with AI, versus 67% of employees.
That 14‑point trust gap creates real risk. Many employees already use AI at work without telling their manager. Most do not get formal training on how to use AI tools responsibly. Nearly half fear AI will hurt their job security. HR leaders are more confident than their teams, but that confidence often hides the real issues. When leaders push AI too fast, employees push back.
The disconnect shows up in daily work. Managers experiment with AI at nearly twice the rate of employees. Yet only a small number of organizations give people clear guidance on how to use the time AI saves them. Without that guidance, AI becomes just another tab open in a browser. Employees do not know what is safe, what is expected, or what will happen if they say no.
41% of employees fear AI’s impact on their jobs. Only 25% of HR leaders think that fear exists. That misread can lead to turnover and resistance before any tool is even rolled out.
37% of employees say they do not use AI even when they can. The main reason is that their coworkers are not using it either. Peer pressure, not technology, drives adoption.
Only 7% of organizations give employees any guidance on what to do with the time AI saves them. Most workers are left to figure that out on their own.
88% of HR leaders report their companies have not seen real business value from AI tools. The problem is not the technology. It is how people adopt and trust it.
Every report is human‑checked and delivered in one business day. You get the latest numbers, not last quarter’s.
Current data from Gartner (July 2025 employee and HR leader surveys), The Access Group/YouGov (December 2025, UK employees and HR leaders), and SHRM.

Only 32% of U.S. workers say their company’s surveys truly capture how they feel. And 47% feel pushed to hold back the truth when they fill them out.
The same workers who hold back honest answers often feel safe giving safe ones. Their job satisfaction, how they see leaders, and their relationship with their manager are the three topics they lie about most. That means your retention plans and wellbeing budgets are built on incomplete data. You might lower turnover risk in the wrong places while real problems go unseen. You might spend on perks that address problems no one actually has.
The gap runs deeper than old surveys can see. Younger employees hold back more than older ones (26% of millennials often feel pressured to hold back, compared to 15% of Gen Xers). And people who work in low‑psychological‑safety environments are far more likely to feel tense, stressed, or even report a toxic workplace. When belonging falls by double digits year over year, you cannot fix engagement without fixing the underlying listening failure.
Most employees doubt survey anonymity (37% say they don’t believe surveys are ever truly private).
People who fear retaliation or blame are nearly three times as likely to call their workplace toxic (30% vs. 3%).
Nearly half of workers don’t give honest feedback because they don’t think it will lead to change.
Managers often overestimate how much employees trust them, so leaders miss the real story on burnout and wellbeing.
The result: you get “satisfied” scores from people who are quietly disengaged, while retention risk continues to grow.
Every report is human‑checked and delivered in one business day. You get the latest numbers, not last quarter’s.
Current data points come from the Visier October 2024 survey (1,000 U.S.‑based employees), the APA 2024 Work in America survey (more than 2,000 employed adults), and the Businessolver 2024 belonging survey (3,100 employees, HR pros, and CEOs).
Employers will lose at least $1.3 trillion to attrition in 2026.
That is a massive cost from people leaving their jobs. Most of that money goes to hiring and training new workers. Voluntary turnover is the main driver. Workers choose to quit instead of staying. Three out of four employees feel overlooked by their employer. Being overlooked leads to burnout and low wellbeing. It also raises retention risk. Many workers start looking for a new job when they feel invisible.
Here is another sign of the problem. 87% of all projected hiring in 2026 is tied to voluntary turnover. That means most job openings happen because someone quit. Not because the company is growing. Workforce planning becomes very hard when you cannot predict who will stay. The $1.3 trillion loss affects every industry and region. No one is immune.
Voluntary turnover will cause 87% of new hires in 2026.
75% of workers feel overlooked by their employer.
The global cost of attrition is at least $1.3 trillion this year.
Feeling overlooked increases turnover risk across all people groups.
Many overlooked employees are already planning their exit.
Every report is human-checked and delivered in one business day. You get the latest numbers, not last quarter’s.
Nearly half of U.S. workers (49%) fear personally losing their job to AI tools and automation. Another 38% worry AI will make some or all of their job duties outdated.
This fear is changing how people think about staying or leaving. Many workers feel pressure to produce more without proper training. 67% of employees say AI has increased productivity expectations at work, and 64% of those workers report higher stress from those demands. Trust is also broken. Only 9% of workers trust AI for complex business decisions, but 61% of executives do. That is a 52-point gap. At the same time, 61% of employees say their organization has not given them adequate guidance on how to use AI effectively.
Younger and early-career workers feel the impact most. Workers with less than one year of experience report the greatest difficulty finding jobs due to AI. 39% say AI has made job access harder for them. Many early-career workers are reconsidering their career paths because of AI. Only 36% of all workers say their employer provides enough AI training. That is down from 45% a year ago.
49% of workers fear personally losing their job to AI tools and automation.
69% of workers believe AI will lead to layoffs at their company within three years.
24% of employees say AI is already hurting their mental health.
58% of employees do not trust their employer to have a clear AI roadmap. Only 36% say their employer offers adequate AI training.
55% of workers who get AI training are more likely to leave for better outside opportunities. They are also twice as likely to quit as less trained peers.
Every report is human-checked and delivered in one business day. You get the latest numbers, not last quarter's.
This report synthesizes data from Modern Health’s 2026 workplace mental health survey (1,000 U.S. employees), WalkMe’s State of Digital Adoption 2026 (3,750 respondents across 14 countries), Jobs for the Future’s 2025 worker survey (3,020 respondents), and Genius HRTech’s 2025 survey (1,704 professionals).
Only 27% of HR leaders have adopted AI in recruiting, and just 21% have adopted it in HR technology. Most of the industry is still waiting to see what works.
Many teams now use AI to spot turnover risks before they happen. Some use it to find skill gaps across the company. Others use it to plan for future hiring needs. But adoption is not the same as maturity. A 2025 study found that 83% of organizations have low AI and automation maturity in HR. And 30% of HR professionals say they have limited knowledge of how to use AI in talent acquisition and management.
AI’s biggest value shows up in workforce planning and skills assessment. Half of HR leaders use AI to match and rank candidates. Almost as many use it to find skills mismatches inside their workforce. Yet only 8% of organizations use AI to map their workforce skills. The rest rely on spreadsheets and self‑assessments.
Key insights from this report:
69% of organizations say candidates already use AI in their job search, but only 18% have scaled AI broadly across their own hiring processes.
Companies that act on AI‑powered retention insights can reduce voluntary turnover by 5‑15% within targeted employee groups.
HR teams using predictive AI can identify at‑risk employees up to three times faster than traditional methods.
31% of organizations currently use some form of AI‑enabled HR technology. ChatGPT is the most common tool, used by 58% of those early adopters.
Every report is human‑checked and delivered in one business day. You get the latest numbers, not last quarter’s.
Current data drawn from 2025–2026 surveys of HR and recruiting leaders across enterprise and mid‑market companies, including Gartner, SHRM, Mercer, LinkedIn, and Sapient Insights Group.

76% of leaders think workers are excited about AI. Only 31% of workers actually are.
That is a huge disconnect. Leaders see a future full of new tools. Workers see stress and job risk. The same split shows up in other areas too. 78% of executives feel good about the economy. Just 39% of associates agree. And trust in the CEO is low. Only 19% of frontline employees trust their CEO. But 52% of executives trust their own CEO.
This reality gap hurts retention and engagement. Workers who do not feel heard will leave. They burn out faster. They stop caring about company goals. Many do not say what they really think. They learn to tell leaders what leaders want to hear.
Every report is human-verified before delivery. You get the latest numbers, not last year's.
76% of leaders believe employees are enthusiastic about AI. Only 31% of workers say they are enthusiastic.
78% of executives are optimistic about the economy. Only 39% of associates share that optimism.
52% of executives trust their CEO. Just 19% of frontline employees trust the same CEO.
This gap creates retention risk. Many workers quietly quit or start looking for a new job.
Leaders who do not see the gap make bad workforce plans. They invest in the wrong things.
Every report is human-checked and delivered in one business day. You get the latest numbers, not last quarter's.
Title: Cross‑Industry Employee Engagement Report
Global employee engagement fell to 20% in 2025. That is its lowest level since 2020 and the second straight year of decline. This drop cost the global economy an estimated $10 trillion in lost productivity. Low engagement means more workers are doing just enough to get by. Some are even acting against their team’s goals. For HR leaders, this creates real problems with retention, turnover, and burnout.
The numbers look different depending on where you look. The United States and Canada have the highest engagement at 31%. Europe has the lowest at just 12%. South Asia saw the biggest drop in engagement of any region. It fell 5 points in one year. Only 16% of employees in South Asia are thriving in their daily lives. That is the lowest wellbeing rate in the world. Also, fully remote employees report the highest engagement at 30%. On‑site workers in non‑remote roles report only 17%.
In the United States, 32% of employees are engaged at work. That is slightly above the regional average of 31%.
Globally, 64% of employees are not engaged. Another 16% are actively disengaged.
Manager engagement has dropped 9 points since 2022. The steepest one‑year drop happened last year. Managers fell from 27% to 22%.
Employee wellbeing improved for the first time in three years. But it only rose to 34%. That means two out of three workers are still struggling or suffering.
Women are more engaged than men. Female employees report 21% engagement. Male employees report 19%.
Before delivery, we verify the intelligence. Every report is human-checked and delivered in one business day. You get the latest numbers, not last quarter’s.

RN turnover is holding at 17% across the US. And 62.5% of healthcare providers say recruitment and retention is their top challenge for 2026.
Turnover is not the same for every role or person. Some groups leave much faster than others. Early-career nurses face the greatest risk. That threatens long-term workforce stability.
The problem looks different by region too. Turnout in nursing homes varies a lot across the country. And many nurses are already planning their exit.
Every report is human‑verified before delivery. You get the latest numbers, not last year’s.
22% of Gen Z and 21% of millennial RNs leave their positions.
41.3% of LPNs and licensed vocational nurses plan to leave the workforce or retire within five years.
In skilled nursing facilities, CNA turnover stays near 42.3%—far higher than most other healthcare roles.
The average hospital loses between $4.2 million and $6.2 million each year from RN turnover alone.
Turnout for RNs ranges from 14.6% in the Northeast to 18% in the South Central region.
You buy it now. We verify the intelligence and deliver it within 12 hours. You get the most current data.
Every report is human-checked and delivered in one business day. You get the latest numbers, not last quarter’s.
Data sources include the 2026 NSI National Health Care Retention & RN Staffing Report and 2026 Axxess Industry Growth Insights Report.
40% of HR professionals say performance management is their top priority. Engagement follows at 39%.
Most teams track engagement and performance separately. They run surveys and then they look at sales numbers. But the two things are tied together. When engagement drops, productivity falls. When engagement rises, profits often rise too. Your workforce planning needs both numbers to work. If you only look at one side, you will miss the real story on turnover and retention risk.
Only 20% of workers globally feel engaged at work. That is one of the lowest levels in over a decade. Low engagement cost the global economy $10 trillion in lost productivity in 2025. This report shows you exactly where engagement and performance connect. It gives you the numbers you need to spot burnout risk and wellbeing gaps before they hurt your business.
Teams with high engagement see 23% higher profitability. They also have up to 18% higher productivity.
High engagement means 51% less turnover. That saves you money on hiring and training.
Disengaged employees can cost companies 34% of their annual salary in lost work. That adds up fast.
Only 21% of employees globally are engaged. Managers are often the missing link.
Companies with low engagement are less profitable. They are also more vulnerable to change.
Every report is human-checked and delivered in one business day. You get the latest numbers, not last quarter’s.
Current data sources include Gallup's 2025 and 2026 State of the Global Workplace reports, which surveyed more than 140 countries and over 263,800 people.
Workforce intelligence for retention, trust, and organizational rhythm. For HR, talent, and operations leads.
Filters
Filters
No results found
No results match your search. Try removing a few filters.
65% of Gen Z consumers plan to drink less in 2025, and 39% plan to adopt a fully alcohol-free lifestyle. That is not just a Dry January phase. It is a permanent mindset shift.
Younger generations are rethinking their relationship with alcohol. Health and mental wellness are the main drivers. Nearly three-quarters of Gen Z choose beverages for functional benefits like gut health, energy, or mood rather than for intoxication. They want drinks that do something for them. At the same time, 82% of Gen Z say ingredients that help relaxation or boost mood are essential or nice to have in the products they buy.
Functional and "alcohol adjacent" drinks are filling the gap. Millennials and Gen Z make up more than 75% of the alcohol adjacent consumer base. In the U.S., 33% of no-alcohol drinkers now choose CBD and functional beverages. These are not just alcohol substitutes. They are chosen for specific effects like calm, focus, or uplift. The global no-alcohol volume is forecast to grow 36% by 2029. Functional soft drink purchases surged 108.8% in 2024 alone.
65% of Gen Z plan to drink less in 2025. 39% plan to stay alcohol-free all year.
82% of Gen Z and 84% of Millennials say mood- or relaxation-boosting ingredients are essential or nice to have in food and drink.
36% of Gen Z have never consumed any alcohol at all. Health concerns are the top reason.
33% of U.S. no-alcohol drinkers now choose CBD, nootropic, or adaptogen beverages for functional effects like relaxation or focus.
Functional soft drink purchases surged 108.8% across U.S. retail channels in 2024, outpacing all other functional beverage categories.
Every report is human‑checked and delivered in one business day. You get the latest numbers, not last quarter’s.
Want to read a sample report? Click here.
Current data sources include Circana 2025, IWSR 2025-2026, GlobalData 2025, NCSolutions 2025, Nuritas 2026, and Keurig Dr Pepper's State of Beverages 2025 report.